Open-source data visualization and SQL query collaboration tool.
Introduction to Redash Architecture
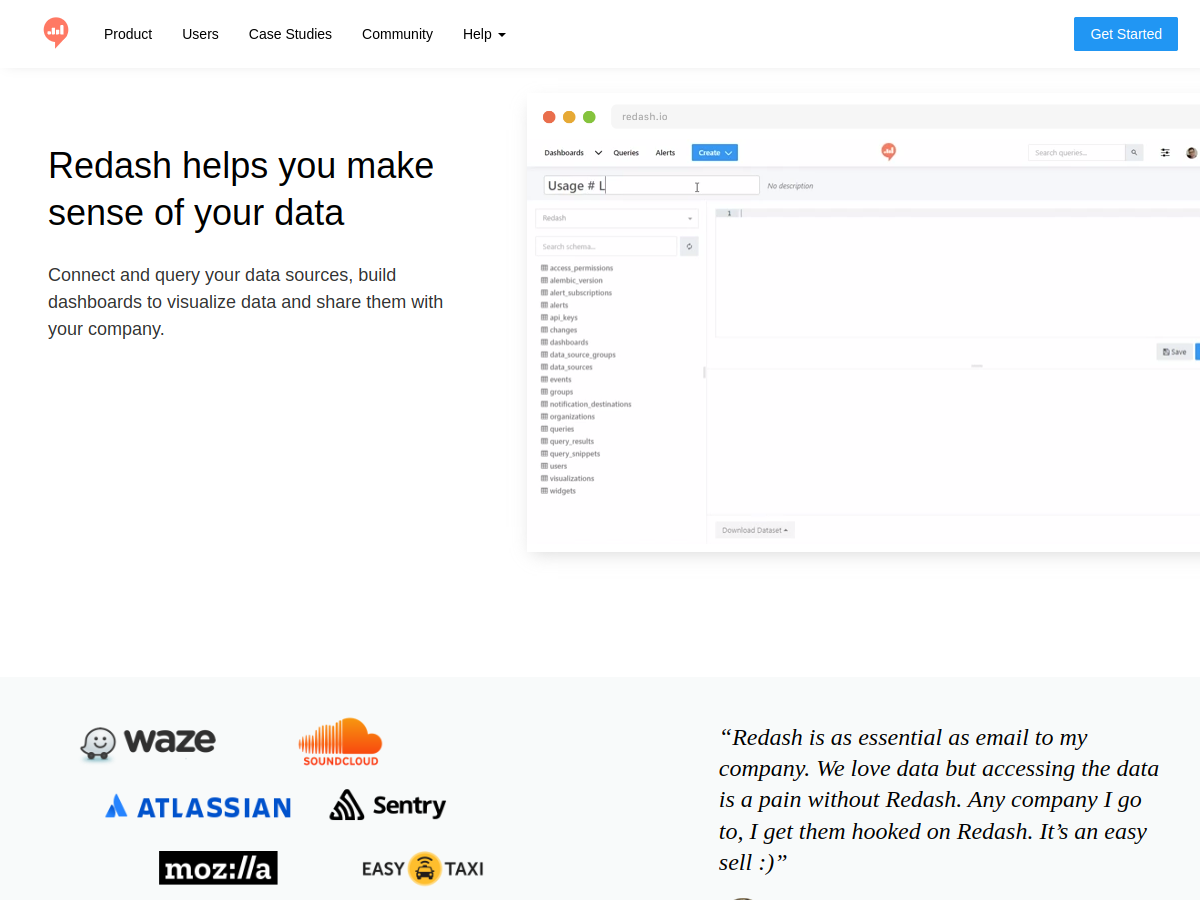
Redash is a highly popular open-source data visualization and collaboration platform designed to make data accessible, transparent, and actionable for everyone inside an organization. It allows data teams to easily connect to a massive variety of data sources, write custom SQL queries, and build insightful dashboards.
Multi-Source Database Integration
One of Redash's greatest strengths is its extensive library of native connectors, supporting everything from relational databases like PostgreSQL and MySQL to cloud data warehouses like Snowflake, as well as NoSQL systems and Google Sheets. This versatility enables unified reporting across fragmented technology infrastructure setups.
Intuitive Visualizations and Sharing
Once a query is written, Redash provides a simple UI to convert raw rows into beautiful charts, cohorts, funnels, maps, and pivot tables. These visualizations can be aggregated into clean dashboards that automatically refresh on a schedule, ensuring all departments stay aligned with the latest data metrics.
Democratic Data Collaboration
By offering an easy interface for sharing queries and results, Redash fosters collaborative peer reviews and data democratization. Team members can fork existing queries, build upon previous work, set up custom alert triggers for key metric changes, and embed live data charts directly into internal team portals.
Unified platform for data integration and data integrity solutions.